8. Number Finale
We are going to make this graph:
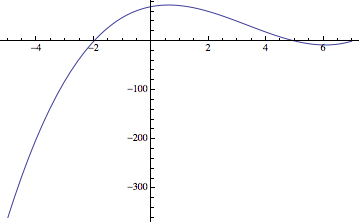
The equation we are using is:
(define (func x)
  (* (- x 5)
     (+ x 2)
     (- x 7)))
The range of people coordinates we want to graph is: $$-5 \le x \le 7 $$ $$-400 \le y \le 100 $$
Your want to make the graph have dimensions 360x250 (in computer coordinates).
-
Write two checks for the function
x-computer->x-peoplethat takes in a computer coordinate and puts out a people coordinate. -
Possibly using WolframAlpha, write the function
x-computer->x-people. -
Write two checks for the function
y-people->y-computer. -
Write and test the function
y-people->y-computer. -
Check your work.
(check-expect (x-computer->x-people 150) 0) (check-expect (y-people->y-computer 0) 50) -
Write a draw handler that will place a dot on the graph of the function. The model will be the computer x-coordinate.
-
Design and test a tick handler that will start on the left side of the screen, trace the curve to the right side, then repeat.
Bonus: Graph of the line
-
Write
rf(orreal-func), which takes in a computer x-coordinate, changes it to people x-coordinates, applies your function, and then changes the result back to computer y-coordinates. You may have already written this as part of your animation. -
Use
build-imageto create a 360x250 image where the amount of gray at (x,y) is given by limiting $$ 100 * \left| y - \text{rf}(x) \right| . $$ -
It took a little extra work to get the axes to show with this method…