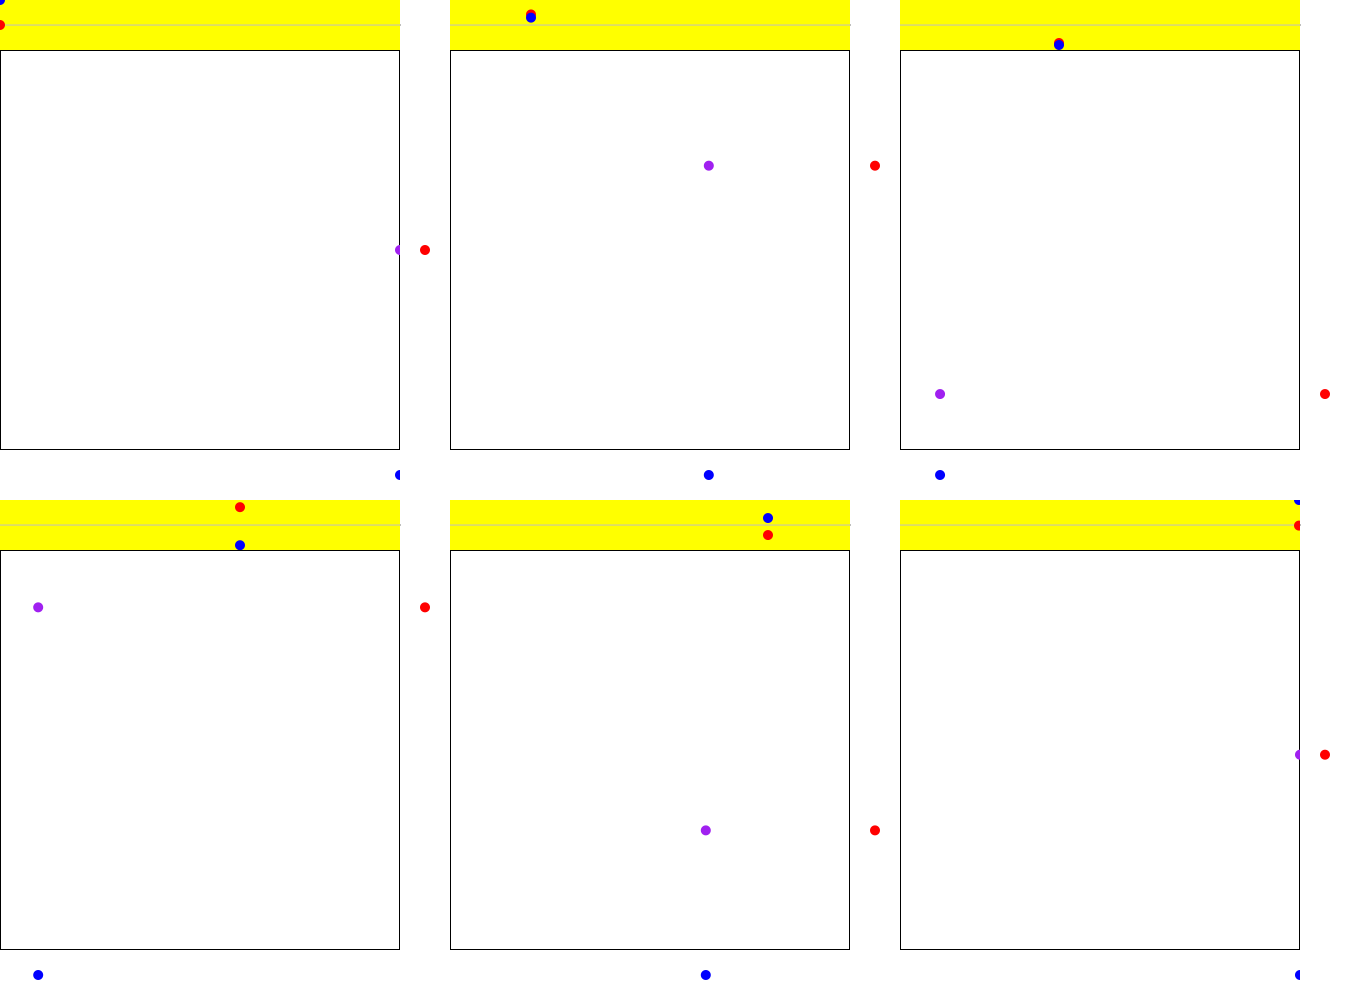
8. Build It Test
The model is a time we will call $t$. The time will be between $0$ and $6\pi$.
The people coordinates are given by:
  (define (x-blue t) (* 200 (cos t))
  (define (y-red  t) (* 150 (sin t))
Yellow Box
Make a 400x50 yellow rectangle for the background. Place a single horizontal gray line in the middle (for the axis).
The horizontal axis of the graph will be “t”. On the vertical axis,
graph the y-red function with a red dot.
- Computer coordinates are $0 \le x \le 400$ and $0 \le y \le 50$.
- People coordinates are horizontally $0\le t \le 6\pi$ and vertically $-200 \le y \le 200$.
After have the first part working, on the same image, graph the
x-blue function vertically with a blue dot. (So really the x-blue will
be a vertical amount.)
Side Bars
The right side bar is a 50x400 white rectangle. The red dot moves
with x-coordinate 25 and y-coordinate given by y-red, using the same model t as the rest of the animation.
The bottom side bar is a 400x50 white rectangle. The blue dot moves with x-coordinate x-red and y-coordinate 25.
Center Box
The center box is a 400x400 outlined rectangle. The purple dot moves
with x-coordinate from x-blue and y-coordinate from y-red.
Demo
