15. Graphing Review
A review of graphing with people and computer coordinates.
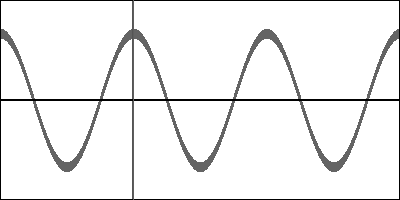
The graph of $f(x)=10 \cos(2x)$ is illustrated below in a window $-\pi \le x \le 2\pi$ and $-15 \le y \le 15$. The graph uses a 400x200 grid of computer pixels.
- Fill in a diagram of what you have and what you need. Draw and label arrows for the functions you have or will write.
| x | y |
|---|---|
| x-people | y-people |
| x-computer | y-computer |
-
Develop
xctxp, the function that changes x-computer to x-people.- Write a horizontal number line (the x-axis is horizontal) and label it with both people and computer coordinates.
- Write two check-expects.
- Figure out the formula, possibly using Wolfram Alpha.
-
Do the same for the y-coordinates. Draw your number line vertical. (The y-axis is vertical!)
-
Find the width of each quadrant. Do not be afraid of fractions!
-
Animate a red dot moving along the graph of the function $y=f(x)$. Have the motion repeat when the dot reaches the right side of the window.
You do not need to show the graph of the function.