15. Heatmap with Contours
We are going to make a beautiful icy winter picture using that idea.
Outline
We use a function of x and y to create a number. Use the number in a heatmap function to produce a color. Build-image to make a picture from this process.
When we draw, we will have conversion functions so we can draw in computer coordinates and do math in people coordinates.
Some people found it confusing to take in a single number to the heatmap function… just don’t call the input to your heatmap either x or y.
Decide the function
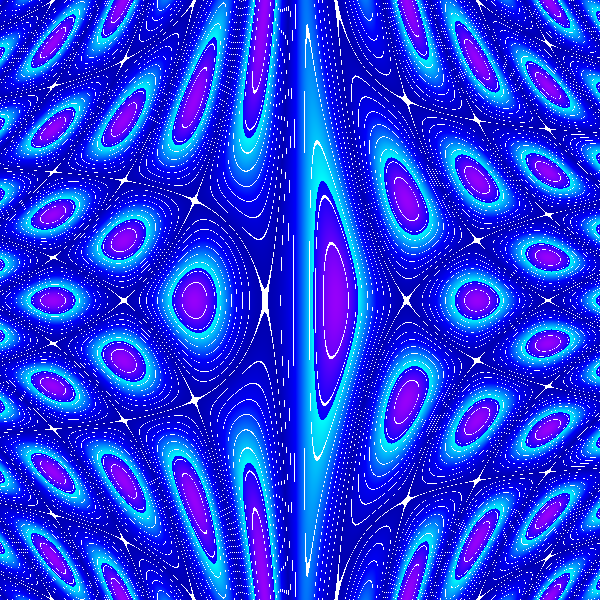
The picture above is made using this function:
$$ f(x,y) = 325 \left( \sin(x) + \cos(x\cdot y /10) \right) $$
In Racket you would type the function:
(define (f x y)
  (* 350
     (+ (sin x)
        (cos (* x y 1/10)))))
Computer coordinates and people coordinates
The picture above is a 600x600 computer coordinate window, with people coordinates $-22.5 \le x \le 22.5$ and $-15 \le y \le 15$.
Create functions to change x and y computer coordinates to people coordinates. Follow the process of making a number line, writing check-expects, and then using a solver to get the equations.
Note: For this project you will only need to change computer to people coordinates.
Colorize the results
The function $f(x,y)$ above gives numbers from -600 to 600.
Use the ideas from the heatmap to use different colors for different values. I made mine in three pieces:
| value | color |
|---|---|
| 0 | blue 175 |
| 250 | blue 250 |
| 251 | green 1, blue 250 |
| 500 | green 250, blue 250 |
| 501 | red 1, blue 250 |
| 750 | red 250, blue 250 |
Contour lines
The picture at the top has little white areas every 75 units — check to see if the value is close to a multiple of 75 and if so, make the color white. These lines are called contour lines.
In a map, a contour line shows where the elevation is the same. In math plots showing those type of lines are called contour plots.