15. Heatmap
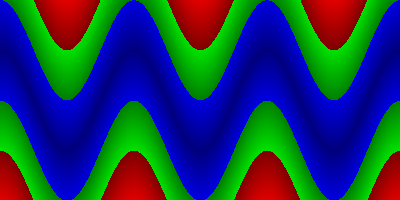
The figure below is 100 pixels wide and 300 pixels tall. Each 100 pixel color segment is a color gradient.

| y-coord | color | color value |
|---|---|---|
| 0 | blue | 125 |
| 99 | blue | 224 |
| 100 | green | 125 |
| 199 | green | 224 |
| 200 | red | 125 |
| 300 | red | 225 |
For example, when y=150, the color produced is (make-color 0 175 0)
because the color is supposed to be green when y is between 100 and 199.
-
Write a function
heat-color: number(y) -> colorthat produces the correct color. -
Write a function
color-helper: number(x) number(y) -> colorthat just calls theheat-colorfunction to get the correct color. -
Use
build-imageto create the 100x300 rectangle pictured above. -
Challenge. Modify your work on the graphing review so that the background is colored based on the distance a point (x,y) is from the graph of y=f(x).
Sketch of the challenge solution
-
The idea is to use the
heat-colorfunction that we wrote earlier.(define (color-outline-1 xc yc) (heat-color (- yc (f xc)))Unfortunately,
xcis in computer coordinates, butfworks only in people coordinates, so we need to add our conversion functions. -
Change the use of
fto thefcversion that works in computer coordinates.(define (fc x) (yptyc (f (xctxp x)))))) -
Sometimes we get negative values and decimals, so add a
fixerand use it in thecolor-outlinefunction to fix the input toheat-color.(define (fixer v) (real->int (abs v))) -
For more vivrant colors, multiply by two in the fixer (or modify the
heat-colorfunction).