Grid
Functions to create a regular grid of posns.
In this project we will create an interactive map showing delivery distances based on locations of storage depots. This project is inspired by the problem parcels from Google’s Kick Start coding competition 2019 Round A.
The CEO of an important delivery company needs your help to decide where to build new warehouses. You are asked to make an interactive map showing the distances from every warehouse to every square on a 10x10 grid. Hopefully, you will be able to easily change it later to a larger or smaller grid.
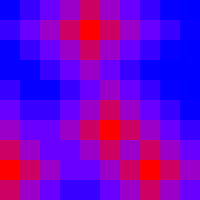
We will use a coloring function (see below) to change distances to color on the red-purple-blue spectrum, so red is close to the warehouse and blue is far from the warehouse.
As an example, a 10x10 grid with warehouses at (4,1) (7,8) (5,6) and (0,8) would produce a distance map like this:
City delivery distance is best measured by just adding the change in x and y between the two locations (because city streets form a grid; usually the truck cannot drive “diagonally” through blocks of houses).
(define (city-distance a b)
  (+ (abs (- (posn-x a) (posn-x b)))
     (abs (- (posn-y a) (posn-y b)))))